Capability Analysis in JMP
Method1
Step1: Data Requirements
Data should be in one column and data type set as continuous.Step2: Go to Univariate Platform
Create a histogram of your measurement data as shown below.Step3: Click on the second hot button
It is the red triangle as shown below. On the drop down menu, select 'Capability Analysis'Step4: Specification Limits
On the resulting dialog box, fill up the necessary information regarding the specification limits and target values. In this case they are 104.41295,118.15322, and 131.89349. For Pp and Ppk, check on the tick box 'Long Term Sigma'. For Cp and Cpk, select either on the tick box 'Moving Range...' and specify the range span, or on the tick box 'Short Term Sigma...'. Note that whichever you choose JMP would use the terms Cp and Cpk in its output. It would specify in the title box of the output though the Sigma your analysis is referring to.Step5: Capability Analysis Output
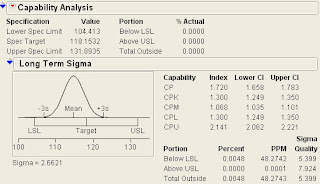
After pressing 'OK', JMP will give you this output.Method2:
Step1: Data Requirements
Same as aboveStep2: Set up the column that contains your data
Right click on the column header to see the following menu. Select 'Column Info'.Step3: Column Properties
On the drop down menu 'Column Properties', select 'Spec Limits'.Step4:Specification Limits
Fill up the necessary information regarding the specification limits and target values. In this case they are 104.41295,118.15322, and 131.89349, and then click 'OK'. Notice on the left side of your data table, and asterisk (*) sign is placed beside the column name where you just set up the specification limits.Step5: Go to Univariate Platform
Create a histogram of your measurement data as shown below. Capability Analysis using Long Term Sigma is included by default.Additional Features:
One of the reasons why I favor JMP over Minitab is its animated graphics. In JMP 8, Capability Analysis includes a feature called 'Capability Animation. To use this, click on the hot button as shown below.
The output window is like the one shown below.You can change the sigma to see its impact on the capability measures. For a JMP script like this where you can change the mean as well, refer to this entry or this entry.


how do we calculate the short term sigma, will it calculte long term only even if we check the short term sigma box.
ReplyDeleteHi Sireesha,
ReplyDeleteNo, if you do not check the "Long Term" sigma it will compute for the "Short Term", but you have to specify the sub-grouping, or the subgroup size.
JMP does not specify this however but assumes that the user knows this before hand.
What value is the CPK result? I'm a little confused on the results?
ReplyDeleteHi Jesse,
DeleteThe Cpk value is the oputput given by the option where you do not check the "Long Term" sigma and have specified the subgroup size.
Regards
I'm very glad that people have been visiting this site and I apologize that it takes half a year (!) for me to respond to the comments.
ReplyDeleteWell I am not a professional blogger and I seldom visit this site unless I am drafting a new entry.
But I will answer the queries nonetheless as a reference for future visitors.
Regards,
Reynald
There are additional features which are really helpful but the basic steps on computing Cp, Cpk, Pp, and Ppk are basically shared by versions JMP 5, JMP 6, JMP 7, and JMP 8. Here are the detailed steps. I will be using JMP 8's sample data 'Semiconductor Capability.jmp'. feng shui master
ReplyDelete